
In today’s data-driven landscape, data analysis is very crucial concept in that extracting meaningful insights from vast datasets is crucial for businesses and analysts. While Tableau excels in intuitive data visualization, its native statistical capabilities are limited. By integrating Python, a powerhouse for data science, analysts can enhance Tableau’s functionality, enabling deeper analysis and more sophisticated modeling.
This post will serve as an in-depth guide to effectively incorporating Python into your Tableau data analysis process, making the information understandable to users of all levels. You may transform your data visualizations into effective tools for insight and decision-making by adhering to the comprehensive guidelines and processes we’re going to go over.

Python is an object-oriented, high-level, interpreted programming language that has become quite popular in software development due to its easy-to-understand syntax. Python was first developed by Guido van Rossum in 1991 and has since grown to be a vital tool in many technological fields, including machine learning and web programming.
In the field of data science, Python is particularly valuable for several reasons:
In addition to data science, Python has applications in many other fields:
Python’s simplicity, combined with its powerful suite of tools and libraries, makes it the language of choice for professionals who want to analyze, visualize, and interpret data to turn complex information into actionable insights.

One of the best tools for data visualization is Tableau, which turns unstructured data into visually appealing and easily comprehensible formats. For data analysts, digital analysts, business intelligence specialists, and decision-makers across a range of industries, its user-friendly interface and capacity to manage massive amounts of data make it a preferred tool.
Tableau is distinguished by its powerful visualization capabilities that enable users to:
One of Tableau’s main strengths is its intuitive interface:
Data-driven decision-making can be greatly enhanced in a business by implementing Tableau. It makes statistics more widely available and helps businesses react faster to changing market conditions and trends.
In summary, Tableau turns data into visual insights that can spur innovation and commercial success, facilitating data visualization and enhancing strategic decision-making.

The integration of Python into Tableau represents a significant evolution in data analysis. It combines the power of programming with the ease of visualization. This combination offers several advantages that overcome the limitations of Tableau’s native functions, thereby expanding the user’s analytical capabilities and flexibility.
While Tableau is excellent for basic visualizations and analysis, some analysis scenarios require more sophisticated computational capabilities, such as:
Python can automate many processes within Tableau, improving efficiency and reducing the time needed for analysis:
By integrating Python, Tableau users can take advantage of the wide range of Python libraries and modules to extend their analysis:
The use of Python within Tableau can also increase the interactivity of visualizations:
The global community of Python developers provides a constant stream of new tools and libraries that can be integrated into Tableau, ensuring that solutions remain state-of-the-art and easily scalable to adapt to new analytical challenges.
In conclusion, Python’s integration with Tableau not only overcomes the limitations of the software’s native capabilities but also opens new doors for analytical innovation, making deeper data insights and more customized analyses possible.

A well-configured working environment is essential for integrating Python with Tableau. This section outlines the prerequisites to establish a compelling connection between Python and Tableau, ensuring you can fully utilise both tools’ capabilities.
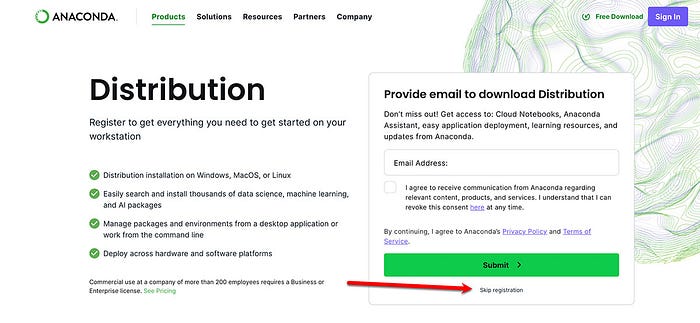
pip install tabpy-server`. More details can be found in the Official TabPy documentation.These prerequisites are essential to fully utilise Python’s integration into Tableau, significantly improving your analytical and visual skills.

Configuring an Anaconda environment specifically for use with Tableau is critical in ensuring that your data analysis sessions are efficient and separate from other Python projects. This helps to keep dependencies organized and avoid conflicts between packages. Here is how to create and configure an Anaconda environment with Tableau.
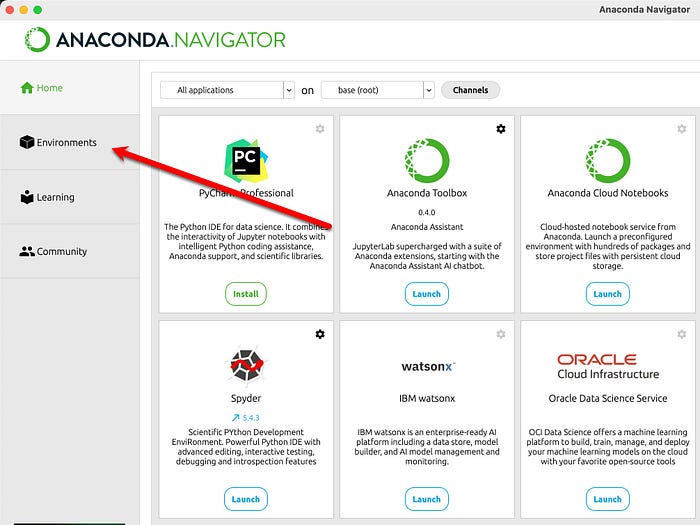
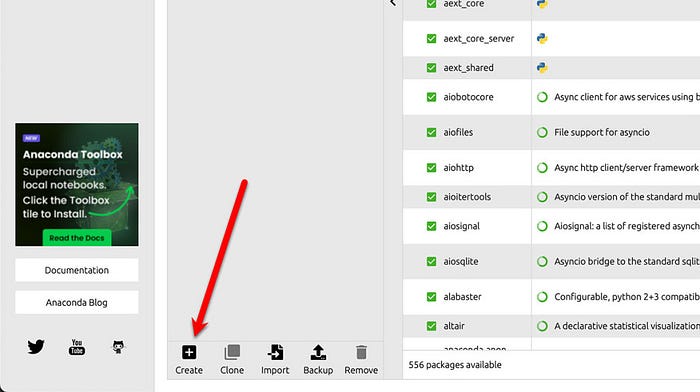
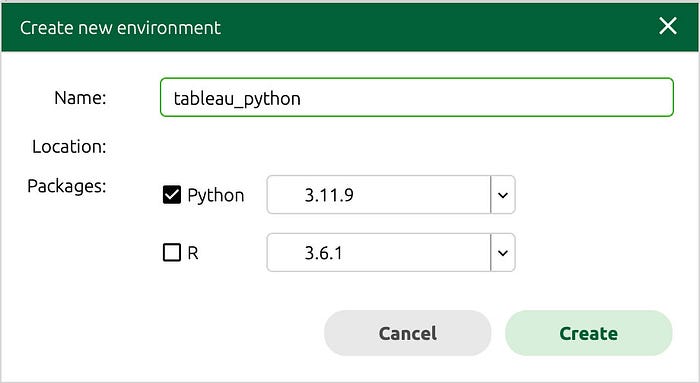
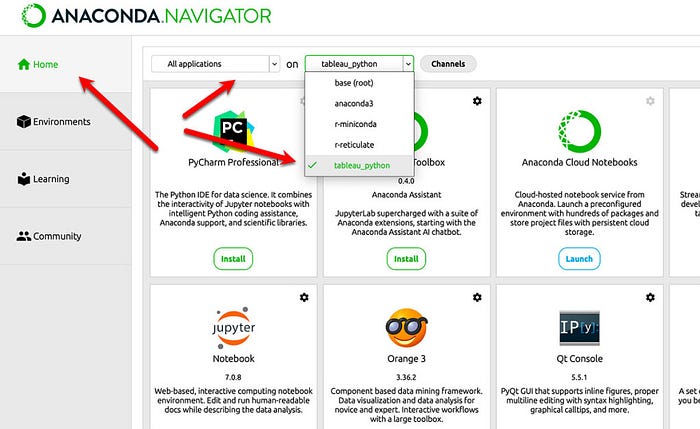
python -m pip install --upgrade pippip install tabpy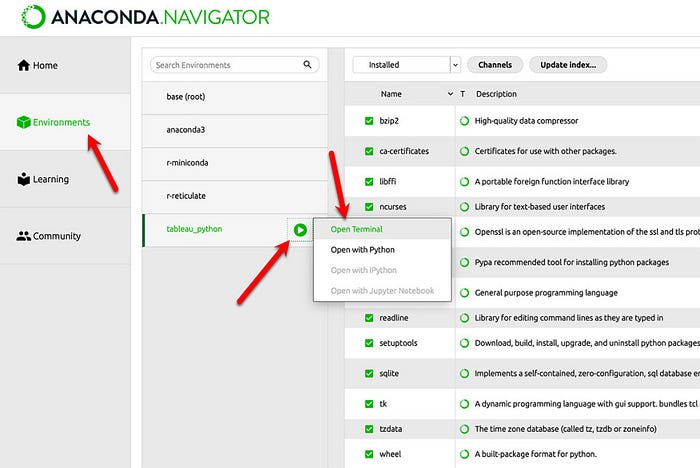
tabpy
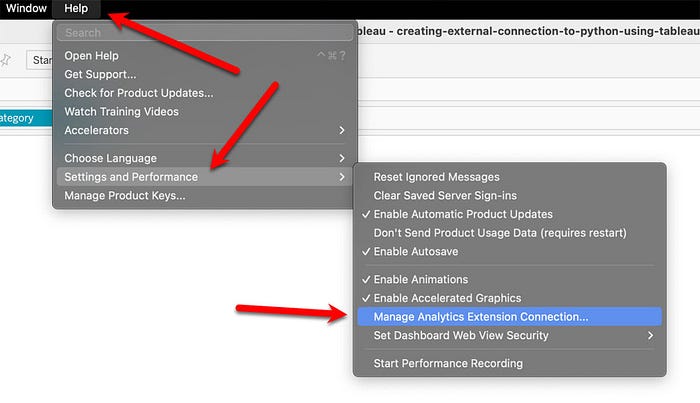
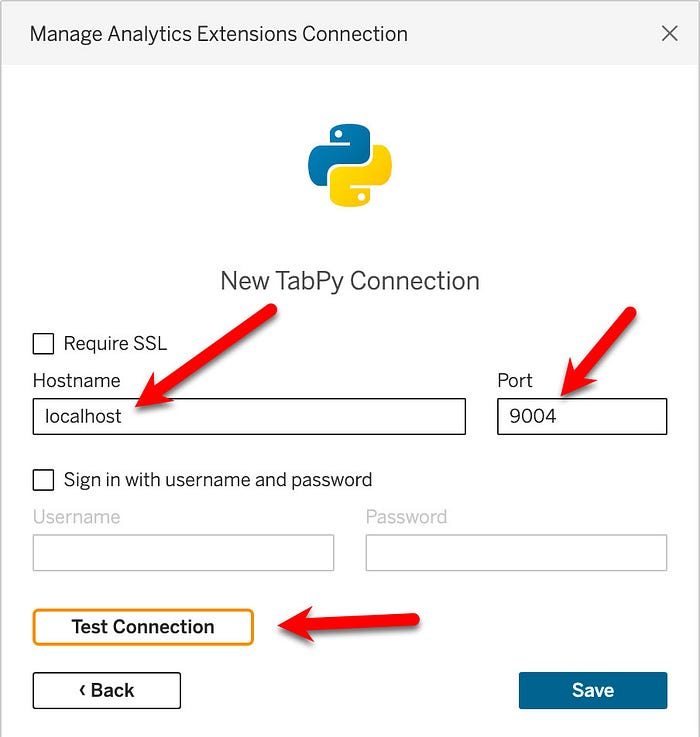
If the connection is successful, click “Save” to close the menu. Now, you can write Python scripts within Tableau Desktop. These scripts will run in your created environment and then be returned to Tableau Desktop as new calculated fields. As a test, write a straightforward equation that takes the sales values from the data from the Superstore dataset embedded in Tableau Desktop and multiplies them by 5 in Python. Python will return the result as a calculated field that you can use in Tableau Desktop. To begin, create a new calculated field, “Python script example”, and enter the following calculation:
SCRIPT_INT("return [int(x * 5) for x in _arg1]",SUM([Sales]))
Now, create a small cross table that you can check to ensure the values are correct. Add “Sub-Category” to “Rows” and then drag “Sales” and “Python script example” to the “Text” property in the “Marks” box with the mouse. You should see results similar to those in the following figure:
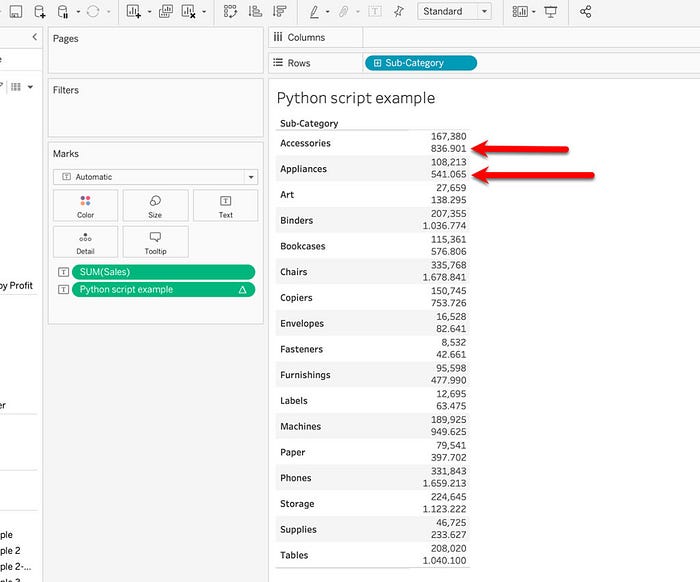
This is a straightforward but helpful example of ensuring everything is working correctly.
Once you have finished working on Tableau, it is always important to disconnect the connection to the server from both Tableau Desktop and the terminal. Return to the “Manage Analytics Extension Connection” menu in Tableau Desktop and select “Disconnect.”
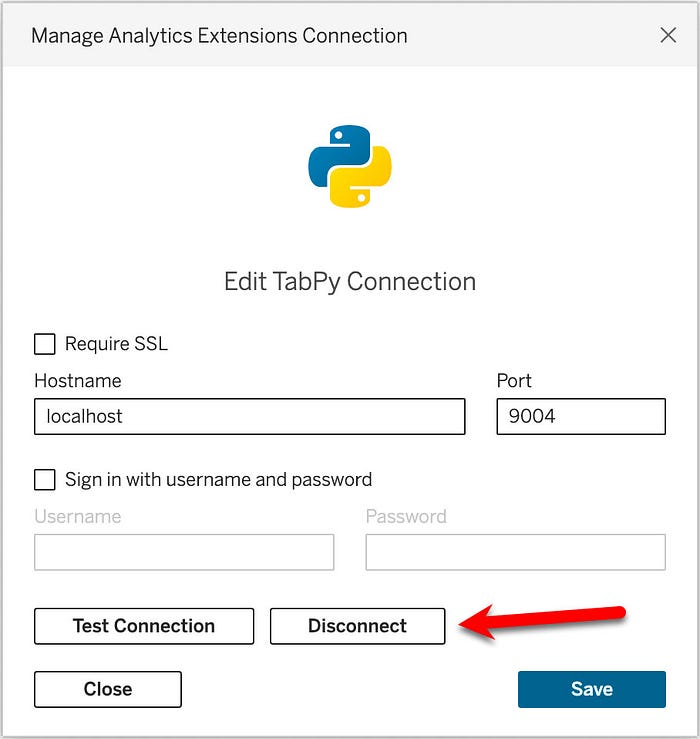
Then go back to the terminal screen and press Ctrl + C

You’ll see a message that says, “Shutting down TabPy…” your command line will reappear.

If you use Tableau Cloud or Tableau Server, you must deploy a TabPy server on a cloud or web hosting platform. You can do this using a Docker file or directly deploying the server on a service such as Heroku.
To run the remote server on Heroku:
You can access your Heroku account via a browser, or if you don’t have one, you can sign up for free.
Go to the TabPy’s GitHub repository and click “Deploy to Heroku” in the section “README.”
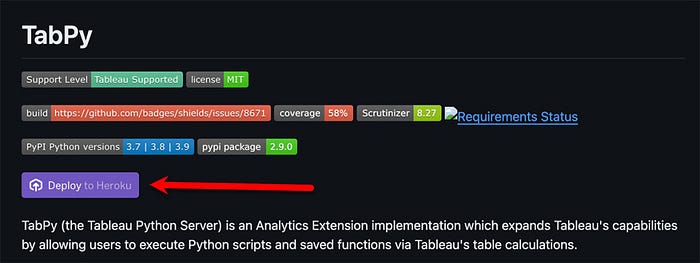
Once the server is activated, you can connect it to Tableau Cloud/Server using the URL and port number.

For this example, we will use a Kaggle data set related to a store’s sales.

You will use Python to calculate the Pearson correlation between sales and profits using np.corrcoef by NumPy, which returns a matrix of correlation coefficients. In Tableau, this calculation assesses the strength of the relationship between two variables directly in visualizations, helping to understand better how changes in one variable can be associated with changes in the other.
Pearson’s correlation coefficient, often denoted “r,” varies between -1 and +1. A value of +1 indicates a perfect positive correlation, -1 indicates a perfect negative correlation, and 0 means no linear correlation between the two variables. Therefore:
Pearson’s correlation coefficient is widely used in many fields, such as economics, biology, social sciences, marketing, and others, to:
Using this coefficient in analytical contexts such as Tableau enriches data analysis by allowing decisions based on specific quantitative insights regarding interdependencies between variables.
We can continue with the example now that we have clarified what Pearson’s Correlation Coefficient is.
To run a Python script in a Tableau calculated field, we need one of these script functions based on the output:
For example, if our function returns boolean values, we must use the SCRIPT_BOOL function. Remember that you can always get integer values and convert them to other types using native functions.
For our calculation, we will use SCRIPT_REAL, which requires two parts: the Python script in quotes and the aggregate arguments.
We will use Python’s Numpy to calculate a correlation between Sales and Profits.
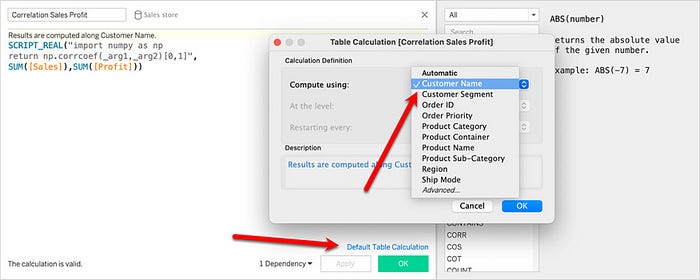
Since we cannot add the arguments directly, we will use placeholders such as “_arg1” and “_arg2” instead. For example, SUM([Profit]) is the second in the order and is linked to “_arg2.” Then, we extract a correlation coefficient from the matrix np.corrcoef to return a single column.
SCRIPT_REAL("import numpy as np
return np.corrcoef(_arg1,_arg2)[0,1]",
SUM([Sales]),SUM([Profit]))
After adding the script to the calculation field, click the “Apply” button. The script will run and return values corresponding to the Customer Name. Before pressing the OK button, click on the link “Default Table Calculation” and change the option from “Automatic” to “Customer Name“.
We conclude by visualizing the scatter plot of product category and customer segmentation:
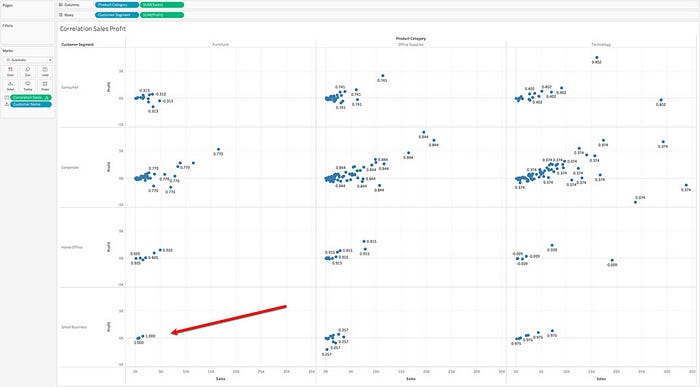
The graph just created shows the customer correlation coefficient by product category and customer segment, indicating a high correlation between Furniture and Small Businesses.
Finally, as indicated above, remember to disconnect from the server connection between Tableau Desktop and the terminal.
That’s it!


To further develop your Python-Tableau skills:
For students needing academic support, StudyCreek provides expert assistance with data analysis projects and coursework.

Integrating Python with Tableau creates a powerful synergy between advanced analytics and intuitive visualization. This combination enables:
As data grows increasingly complex, professionals who master both tools will have a significant competitive advantage. The integration process is straightforward, and the payoff in analytical capability is immense.
For those looking to accelerate their learning, StudyCreek offers personalized guidance on Python, Tableau, and data science implementations. By combining these technologies, you can transform raw data into truly actionable business intelligence.
Delivering a high-quality product at a reasonable price is not enough anymore.
That’s why we have developed 5 beneficial guarantees that will make your experience with our service enjoyable, easy, and safe.
You have to be 100% sure of the quality of your product to give a money-back guarantee. This describes us perfectly. Make sure that this guarantee is totally transparent.
Read moreEach paper is composed from scratch, according to your instructions. It is then checked by our plagiarism-detection software. There is no gap where plagiarism could squeeze in.
Read moreThanks to our free revisions, there is no way for you to be unsatisfied. We will work on your paper until you are completely happy with the result.
Read moreYour email is safe, as we store it according to international data protection rules. Your bank details are secure, as we use only reliable payment systems.
Read moreBy sending us your money, you buy the service we provide. Check out our terms and conditions if you prefer business talks to be laid out in official language.
Read more